
National Drowning Report 2025
The National Drowning Report 2025, released on Tuesday 26th August at Parliament House, Canberra showed drowning is a persistent and traumatic issue that affects thousands of families, first responders and communities every year.
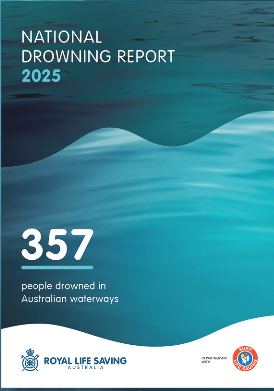
The National Drowning Report 2025, published by the Royal Life Saving Australia in partnership with Surf Life Saving Australia, found there were 357 drowning deaths over the past 12 months, which was 27% higher than the 10-year average.
The National Drowning Report 2025 insights include:
- 357 drowning deaths over the past 12 months, a 27% increase on the 10-year average.
- The lowest rates of drowning were in children 5-14 years, but this rises sharply by ages 15-24 years.
- Drowning rates were above the 10-year average for every age group over 45 years.
- One third (33%) of all drowning deaths were adults aged 65 and older (118).
- The highest drowning rates were in people aged 75 years and older.
- 43% occurred in coastal locations (154), including 82 drowning deaths (23%) at beaches.
- 34% at inland waterway locations (122), including 99 drowning deaths (28%) at rivers.
- 10% occurred in swimming pools (35 deaths), 68% of those deaths were in backyard pools.
- Where country of birth was known, 33% were born overseas, consistent with the 10-year average.
- Inequities persist – drowning rates double for those from the most disadvantages areas and nearly triple for regional and remote residents compared to major cities.
QUEENSLAND SPECIFIC INFORMATION
Queensland’s Toll: Rising Risks, Disadvantage, Older Adults
- 90 drowning deaths in Queensland from July 2024 to June 2025, a 36% increase on the state’s
ten-year average. - Fatal drowning rates rose to 1.62 per 100,000 population, up 24% year-on-year.
- People aged 75 year and over made up 20% of Queensland’s drowning deaths and recorded
the highest crude drowning rate (4.16 per 100,000 population). - People living in disadvantaged areas (IRSAD deciles 1-4) comprised 35% of drownings,
underlining stark social inequalities in aquatic safety. - Leading locations: Rivers/creeks (32%) and beaches (23%). Beach deaths were up 62% from
the ten-year average. - 31 coastal drowning deaths (25% of QLD drowning burden, n=90)
- 33% QLD beach incidents rip-related
- Activity prior to drowning: Swimming and recreating was the most common activity (30%),
followed by an unintentional fall into water(13%). - July 2024 saw more than double the ten-year average of beach drownings in Queensland (11
deaths this year versus a 10-year average of 4).
Comparison with National Figures
- Queensland was one of the states with the largest increase, alongside South Australia,
Western Australia, and New South Wales. - The state showed a similar risk profile: men and older adults were most at risk, and those in
disadvantaged or regional areas drowned at higher rates. - Nationally, 33% of deaths occurred in adults aged 65+ years, also closely mirrored in
Queensland’s data. - While national increases were also seen in rivers/creeks and on beaches, Queensland’s spike
in beach-related deaths is a key concern.
Previous National Drowning Reports
- National Drowning Report 2005
- National Drowning Report 2004
- National Drowning Report 2003
- National Drowning Report 2002
- National Drowning Report 2001
- National Drowning Report 2000
- National Drowning Report 1999
- National Drowning Report 1998
- National Drowning Report 1997
- National Drowning Report 1996
- National Drowning Report 1995
© Royal Life Saving Society Queensland Inc ABN 60 478 008 791 RTO 5431